Welcome to Noodles.gl
Noodles.gl is the animation studio for maps — a node-based editor for building cinematic geospatial visualizations, entirely in the browser.
What makes it different
Most map tools give you a static snapshot. Noodles gives you a timeline. Every parameter in your visualization — camera angle, layer opacity, data filter, color ramp, arc height — can be keyframed and animated with bezier interpolation.
The result: data-driven stories you can export as video, publish as interactive pages, or render as print-quality stills.
What you can build
- Cinematic route animations — fly a camera along a path while trip data trails behind, with smooth easing and timed reveals
- Temporal data stories — scrub through years of earthquake activity, urban growth, or flight patterns with a single timeline
- Live data dashboards — wire a DuckDB SQL query to a map layer; the visualization updates reactively when inputs change
- Publication renders — export at any resolution (4K video, 300dpi stills) with 40+ GPU-accelerated layer types
- Repeatable workflows — every project is a portable JSON file you can version-control, share, and re-run on new data
Who it's for
Storytellers who need motion — you have a dataset and a narrative, and static maps aren't enough. Visualization engineers who want composability — wire up reactive pipelines instead of writing imperative rendering code. Data teams publishing analysis — go from exploration (DuckDB query, scatter plot) to polished animated render without switching tools. Researchers sharing results — hand someone a project file and they see exactly what you see.
How it works
Noodles.gl uses a pull-based reactive graph: you connect operators (data sources, transforms, visualization layers) and the output updates automatically when any upstream input changes. There's no "run" button — changes propagate in real time.
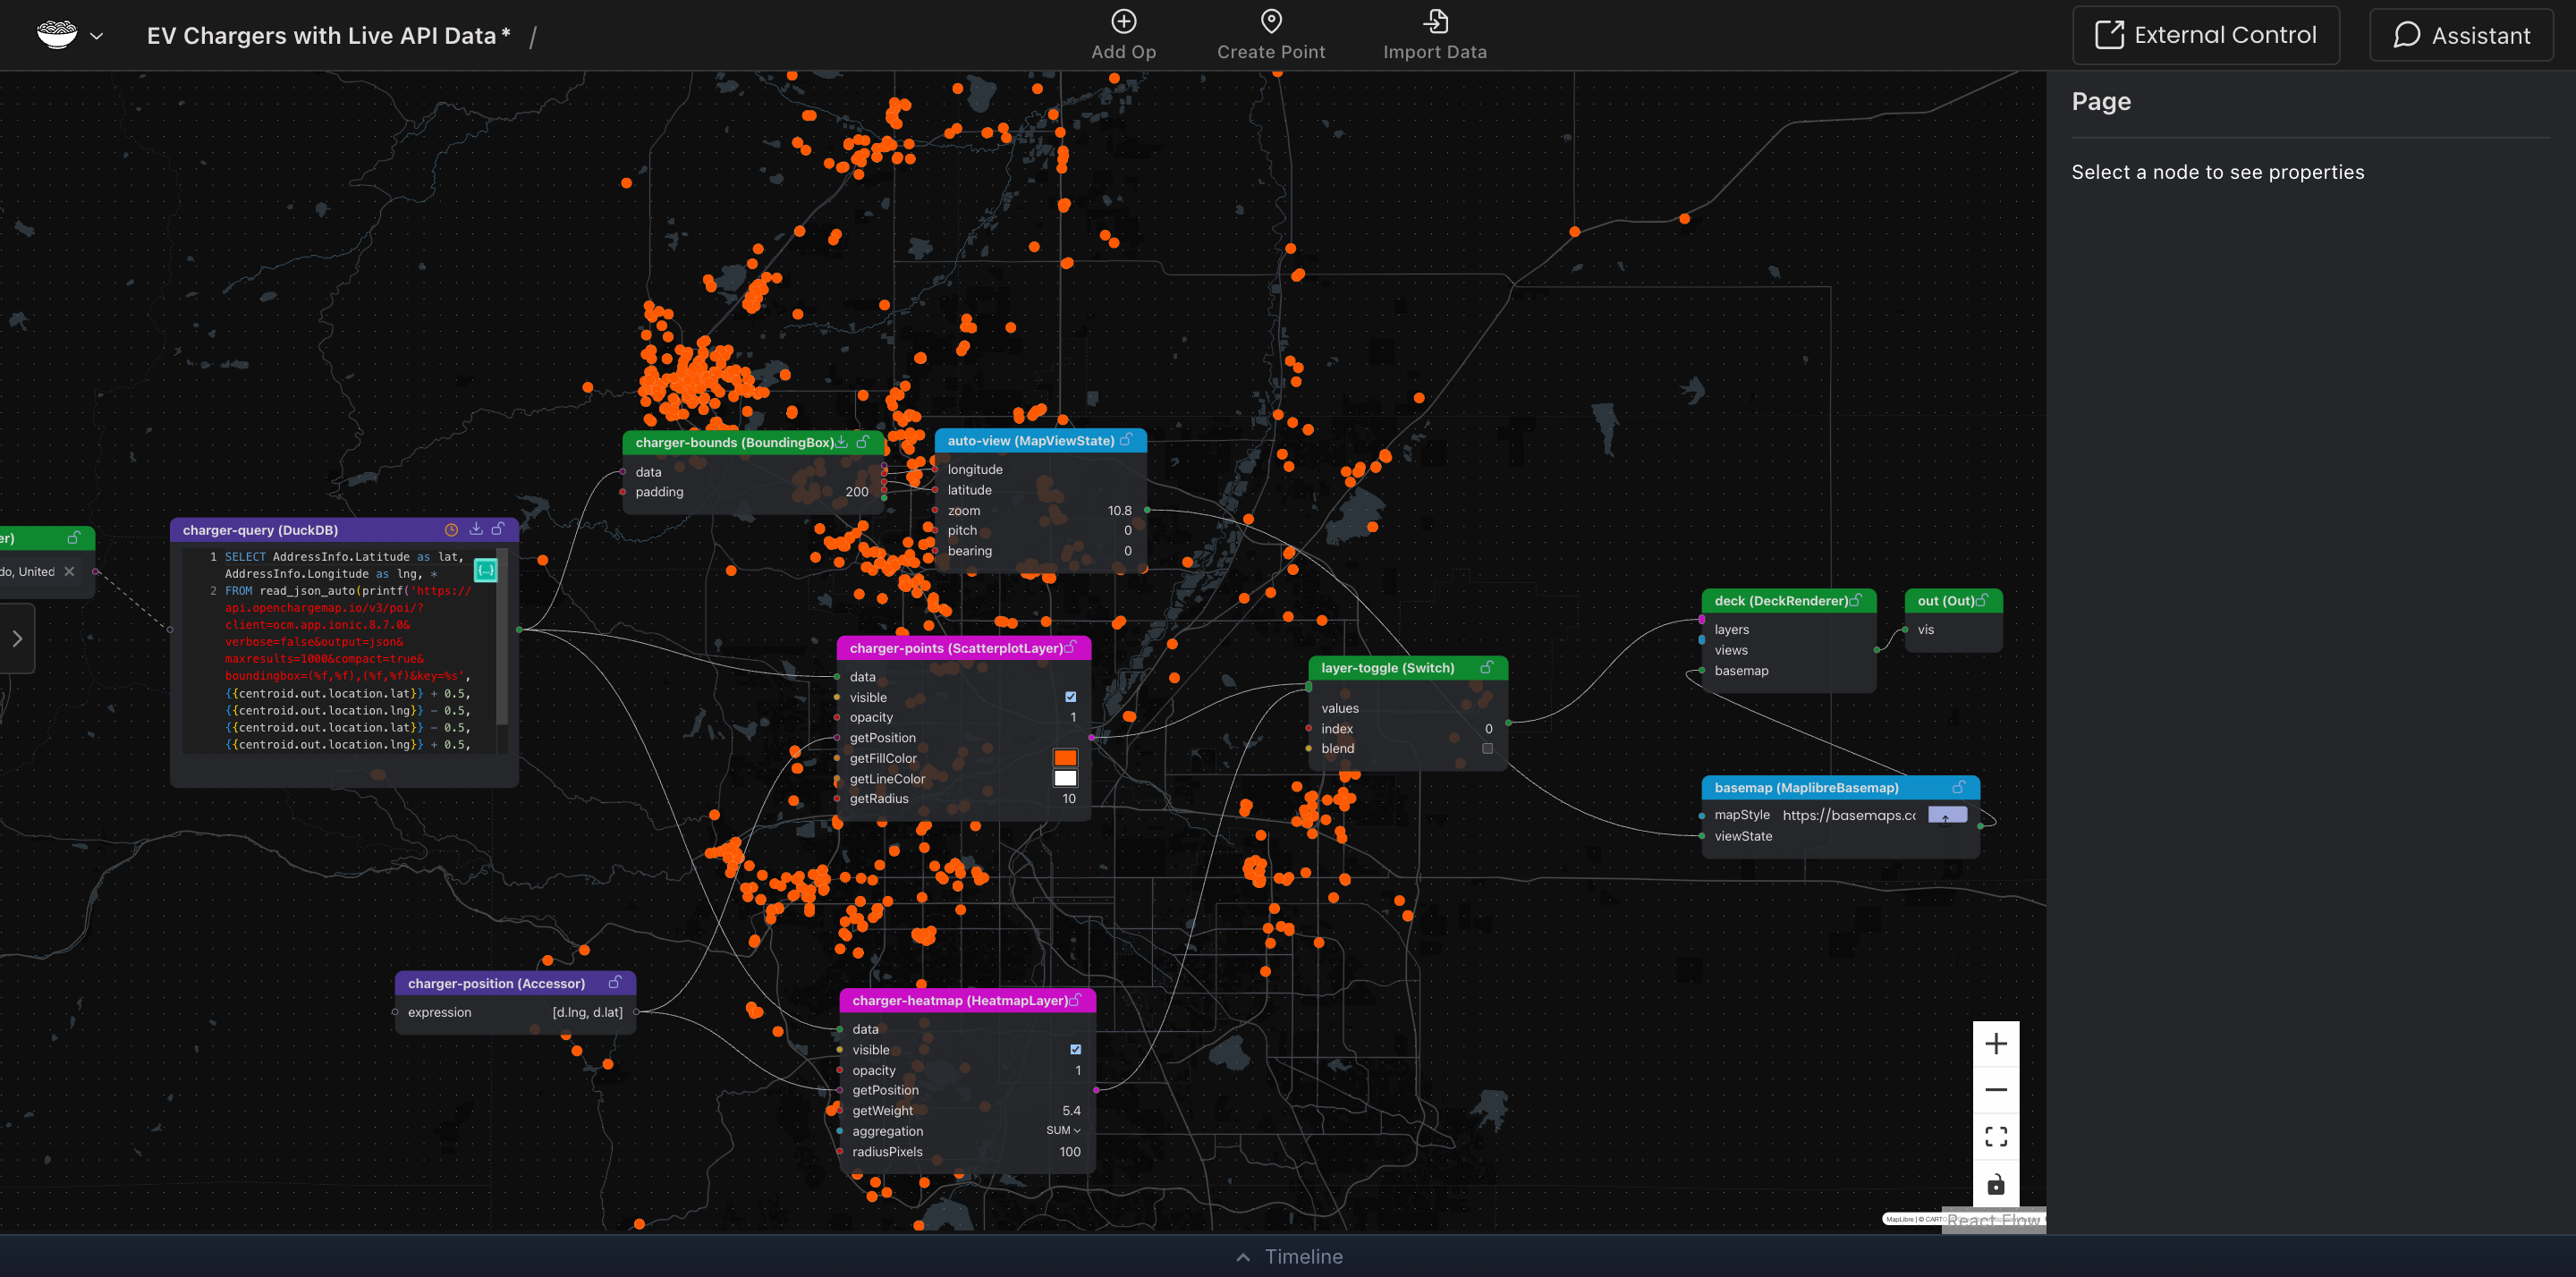
The timeline editor lets you keyframe any parameter at any point in time. Scrub, preview, adjust curves, then export — the same workflow motion designers use in animation tools, applied to geospatial data.
Get started
- Getting Started → — learn to load data, build graphs, animate, and export
- Framework Developers → — extend Noodles.gl with custom operators and field types